Evolution of Wave Theory
Ralph Nelson Elliott is the father of the Wave Theory who invented the wave principle. Ralph Nelson Elliott was Born on July 28, 1871, in Marysville, Kansas. He started his career as an accountant. In his early professional life, Elliott faced intestinal illness, due to which he was forced into early retirement at age fifty-eight.
Before his retirement, Elliott wrote two books Tea Room and Cafeteria Management and The Future of Latin America. These two books were based on his professional experience
After his retirement, in his leisure time to keep his mind busy, he turned his full attention to observe & analyse the stock market.
Elliot observed the data of many charts covering 75 years of stock market behavior. After his detailed analysis & findings, he wrote his third book in collaboration with Charles J. Collins. He entitled this book as The Wave Principle, published on August 31, 1938. Elliott said that though the stock market prices are unpredictable they actually follow some natural laws and can be measured and forecast using Fibonacci numbers.
After the publication of The Wave Principle, Financial World magazine (the United States’ oldest business magazine) commissioned Elliott to write twelve articles (under the same title as his book) in which he was supposed to describe his latest analytical technique for predicting the stock market. His final published book was: Nature’s Law –The Secret of the Universe published in June 1946, two years before he left this world.
His excellent work of wave analysis helps many big institutional investors & portfolio managers even today.
What is the Elliott Wave theory?
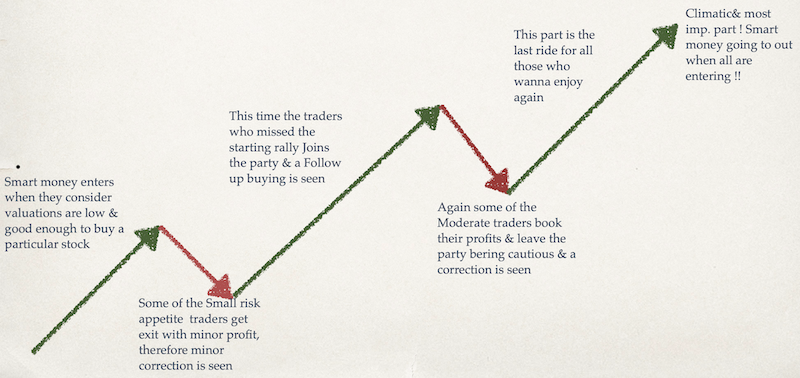
The Elliott Wave Principle is a technique which elaborates the behavior of the crowd or a group of people over certain things.
The best example for the application of Elliott Wave Principle can be seen in the stock markets. In the stock markets, the traders & investors are having different psychology which keeps on changing again and again with many of the factors & events happenings. These psychologies are recorded in the form of price actions and they form a particular pattern which is repeating in nature with time. If we can figure out these repeating patterns in the price actions & find that where we stand in these repeating patterns today, we can predict where we can reach tomorrow. Elliott Wave Principle evaluates this psychology of traders & investors, which is the real driving power behind the stock markets. By using the Elliott Wave Principle, We can identify the highest probable moves which can bring us big gains with the least risk factors.
What is the Elliott Wave & how it looks like?
Elliott waves are the key elements of the Wave Principle. Elliott evaluated 13 patterns of movement, which he named them as “waves,” that occur in market price data and are repetitive in form but not necessarily repetitive in time or amplitude. He named, defined and illustrated the patterns. These patterns are known as Elliott waves.
These Elliott waves link together to form larger versions of those same patterns which in turn, link to form identical patterns of the next larger size, and so on. The result is the illustration you see below:

The basic pattern Elliott described in his findings consists of impulsive waves which are denoted by numbers and corrective waves which are denoted by letters. An impulsive wave is formed of five subwaves and moves in the same direction where the major trend is going. A corrective wave is formed of three subwaves and moves against the trend of the next larger size.
In Figure 1, the first sequence is an impulsive wave consisting of five small waves which end up at the peak designated as (1). This pattern tells that the upcoming movement of one larger degree will be also an upside movement. It also signifies the start of a three-wave corrective sequence, designated as wave (2). Waves (3), (4) and (5) complete a larger impulsive sequence, designated wave [1].
As we can see with wave 1, the impulsive structure of wave (1) tells us that the movement at the next larger degree will be upward and signify the beginning of a three-wave corrective downward movement of the same degree as wave (1). This correction, wave (2), is being followed by the next continuing waves (3), (4) and (5) to complete an impulsive sequence of the next larger degree, designated as wave [1]. Once again, a three-wave correction of the same degree occurs, designated as wave [2].
It should be noted that each “wave one” peak, the implications are the same regardless of the size of the wave. Waves forms in degrees, the smaller waves are the building blocks of the larger waves. Here are the accepted notations for designated as Elliott Wave patterns at every degree of a trend:
| Wave Degree | 5s With the Trend | 3s Against the Trend |
| Grand or MajorSupercycle | [I] [II] [III] [IV] [V] | [A] [B] [C] |
| Super cycle | (I) (II) (III) (IV) (V) (A) (B) (C) | Cycle I II III IV V A B C |
| Primary cycle | [1] [2] [3] [4] [5] | [A] [B] [C] |
| Intermediate cycle | (1) (2) (3) (4) (5) | (A) (B) (C) |
| Minor movement | 1 2 3 4 5 | A B C |
| Minute movement | [i] [ii] [iii] [iv] [v] | [a] [b] [c] |
| Minuette movement | (i) (ii) (iii) (iv) (v) | (a) (b) (c) |
| Subminuette movement | i ii iii iv v | a b c |
*degrees normally denoted by circles are here presented with brackets.
BASIC RULES OF WAVE THEORY:
The correct Wave Analysis depends upon how accurate the waves are identified. The correct designation of the waves enables us to take a view on the likely move of the market, and thereby to position ourselves correctly as long or short.
So, we need to follow some Rules and Guidelines.
The Rules must be followed by an elliotician very strictly & should NEVER be broken. However there is relaxation in guidelines sometimes, but they are still very important in wave identification. These rules and guidelines are as follows:
Rules:
- Wave 2 never corrects 100% of wave 1
- Wave 3 can never be the shortest one among waves 1, 3 and 5.
- Wave 4 never intervene into the territory of wave 1.
Guidelines:
- Wave 2 and Wave 4 generally get a bounce back from the Fibonacci retracement levels. This tells that the trend is continuing.
- Wave 3 is the longest one out of waves 1,3 and 5 which is very steeply inclined.
- Sometimes wave 5 fails to move beyond the extreme end of wave 3. This is known as truncation.
- Wave 5 breaks above the ascending channel of the impulsive wave.
NOTE: These rules and guidelines are to be followed for the impulse wave. The corrective waves may have a lot of variations.
WHAT’S BEHIND THE WAVES?
BASIC WAVE STRUCTURE

IMPLEMENTATION OF ELLIOT WAVE TO THE CRUDE OIL PRICES TILL DATE
EXPLANATION
- In 1999 no one has imagined the prices of the oil will touch the sky & today we have given a name of BLACK GOLD to the oil.
- During wave 1 from $15 to $40, only a few investors were able to identify the importance of the oil.
- In the second wave, most of the small risk appetite traders had booked their early gains in the year 2000.
- After the nice correction, the potential of investment in oil was known to everyone & all had participated in the 3rd wave & brought the price to $80 in the year 2006
- In 2006 when the prices reached $80 some of the moderate traders who joined the rally in the starting of the 3rd wave booked the profit & formed a 4th wave (a corrective wave) & brought the prices to $51.
- Again the BIG institutions found the valuation is good enough to buy the oil & this gave birth to the wave 5 which leads to $147.
- In the year 2008, when the whole world was concerned the about the higher prices of the oil & retails were doing an entry to buy the oil, a sudden fall has been seen & the prices were crashed below $40. (WHEN ALL WERE PREPARED TO ENTER, SMART MONEY WAS READY TO GET EXIT)
To obtain a full understanding of the Wave Principle including the terms and patterns, please read Elliott Wave Principle by A.J. Frost and Robert Prechter, or take the free Comprehensive Course on the Wave Principle on this website.
Thank you very much, sir, for this article. Looking forward for more Technical Analysis articles.
Superb article, found interesting as it is in layman language anyone can understand.
Thanks Nik and Manish Sir
That seems to be really good. Clean and point clear
Very helpful article. Thanks sir
Super Analysis and superbly explained
Article is helpful, Thanks TRADING SUTRA.
Mind blowing guruji
Very helpfull article
Very goog article
Very nice explained thank you